The Unknown Truth:
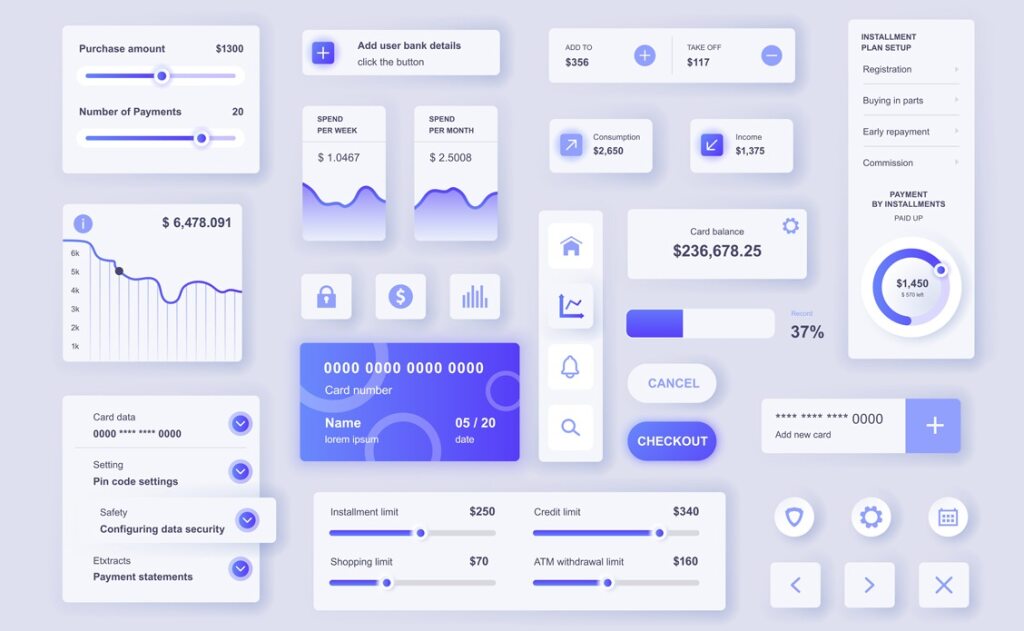
“Your code can be perfect, but if your dashboards tell a messy story, buyers will discount your valuation by 40-60%. Technical excellence doesn’t drive acquisition premiums—business intelligence clarity does. While you’re obsessing over architecture, buyers are obsessing over whether your data tells them how to make money.”
I’ve seen unicorn-quality codebases fail to attract premium offers because their business dashboards looked like data graveyards. Meanwhile, companies with decent code but crystal-clear business intelligence dashboards commanded 3x higher multiples. Buyers don’t acquire your code—they acquire your ability to generate predictable outcomes, and dashboards are how they verify that ability.
NextAccel 3D Dashboard Excellence Framework
DEFINE – Business Intelligence Strategy
- Map buyer decision-making processes to dashboard requirements
- Identify key performance indicators that drive acquirer confidence
- Analyze competitor dashboard strategies that secured premium valuations
- Benchmark dashboard sophistication against buyer integration standards
- Model dashboard narratives around buyer value acceleration metrics
DEPLOY – Acquisition-Grade Dashboard Architecture
- Build dashboards that mirror buyer reporting frameworks
- Establish real-time data pipelines that pass enterprise diligence standards
- Create executive-level visualizations that translate to buyer boardrooms
- Develop predictive analytics dashboards that demonstrate growth trajectory
- Structure data governance that supports acquisition integration timelines
DELIVER – Premium Value Communication
- Execute dashboard strategies that solve buyer strategic blind spots
- Build performance visualizations that buyers want to inherit
- Establish data storytelling that justifies acquisition premiums
- Create financial dashboards that trigger buyer acquisition criteria
- Position business intelligence around buyer decision-making acceleration
This is data-driven acquisition positioning, not pretty charts. Every dashboard element becomes a valuation catalyst when engineered from buyer evaluation psychology.
Step 1: Diagnose Your Dashboard Readiness (Start Here)
Challenge yourself with this exercise:
“If [Your Most Likely Acquirer] accessed our dashboards today, would they see predictable growth patterns or confusing data chaos? Can they understand our path to profitability in under 60 seconds?”
If your answer requires explaining your metrics instead of letting them speak for themselves, you’re building founder dashboards, not buyer decision tools.
Step 2: Reverse-Engineer the Buyer’s Dashboard Logic
Your diagnostic: Rate your dashboards against your primary buyer type’s evaluation criteria. Anything below 8/10 becomes your dashboard optimization roadmap.
Strategic Buyers Focus On:
- Market share growth trajectories
- Customer acquisition efficiency trends
- Product adoption velocity metrics
- Competitive positioning indicators
Financial Buyers Focus On:
- Revenue predictability patterns
- Unit economics optimization trends
- Cash generation acceleration metrics
- Expansion opportunity indicators
Step 3: Rebuild Your Dashboard Architecture (The Reverse-Engineering Process)
A. Make Strategic Dashboard Decisions:
If targeting strategic buyers: Build dashboards that show how you accelerate their existing business metrics. Study their quarterly reports—mirror their KPI language and measurement frameworks in your visualizations.
If targeting financial buyers: Demonstrate cash flow predictability and growth leverage through dashboard storytelling. Show clear paths to margin expansion and market capture within their investment timeline.
B. Engineer Buyer-Friendly Data Presentation:
Executive Dashboards: Create board-level views that translate directly to buyer executive presentations. Use visualization standards that integrate with enterprise reporting tools.
Operational Dashboards: Implement real-time monitoring that demonstrates operational excellence and scalability readiness. Buyers pay premiums for businesses they can immediately plug into their operations.
Financial Dashboards: Establish revenue recognition and profitability reporting that matches buyer accounting standards. Many deals fail because financial dashboards can’t survive enterprise audit requirements.
C. Build Acquisition-Critical Dashboard Assets:
Predictive Analytics: Develop forecasting dashboards that show buyers your growth trajectory with statistical confidence. Forward-looking data commands premium valuations.
Customer Intelligence: Create customer health and expansion dashboards that buyers want to inherit. Lifetime value and retention trend visualizations are acquisition gold.
Competitive Positioning: Establish market share and competitive analysis dashboards that demonstrate your strategic moat and market leadership.
Step 4: Continuous Dashboard Optimization
Run this scenario planning exercise quarterly:
“Buyer X just acquired our closest competitor. Based on their integration announcements, what dashboard capabilities would make them pay 20% more for us? What data blind spots would force them to discount our offer?”
Premium value creators our clients build:
- Real-time customer success dashboards that reduce buyer churn risk
- Predictive revenue dashboards that demonstrate growth sustainability
- Operational efficiency dashboards that show integration ease
- Market intelligence dashboards that enhance buyer competitive positioning
Value destroyers that kill acquisition premiums:
- Inconsistent metric definitions across dashboard systems
- Historical data gaps that prevent trend analysis
- Manual reporting processes that don’t scale
- Dashboard complexity that obscures business fundamentals
The Strategic Outcome: Built for Buyer Confidence
Dashboard-driven acquisition strategy creates multiple advantages:
- Higher Valuations: Clear business intelligence drives premium multiples over technical metrics alone
- Faster Due Diligence: Transparent dashboards accelerate buyer decision-making timelines
- Multiple Bidders: When dashboards demonstrate predictable outcomes, you create competitive acquisition dynamics
- Integration Confidence: Buyers pay premiums for businesses with acquisition-ready data systems
Final Framework:
If your dashboards require explanation to understand your business performance, you’re not building an acquisition target—you’re building a buyer’s due diligence nightmare.
“Acquisition premiums aren’t paid for clean code—they’re paid for clean business insights. Every dashboard visualization, every KPI selection, every data presentation choice should consider: ‘Does this increase or decrease buyer confidence in our predictable growth?’ Build dashboards for buyers, and buyers will build your valuation.”
Ready to transform your dashboards into acquisition assets?
Contact us for a Dashboard Readiness Assessment and identify your highest-impact data visualization opportunities and intelligence gaps that could limit buyer confidence.


