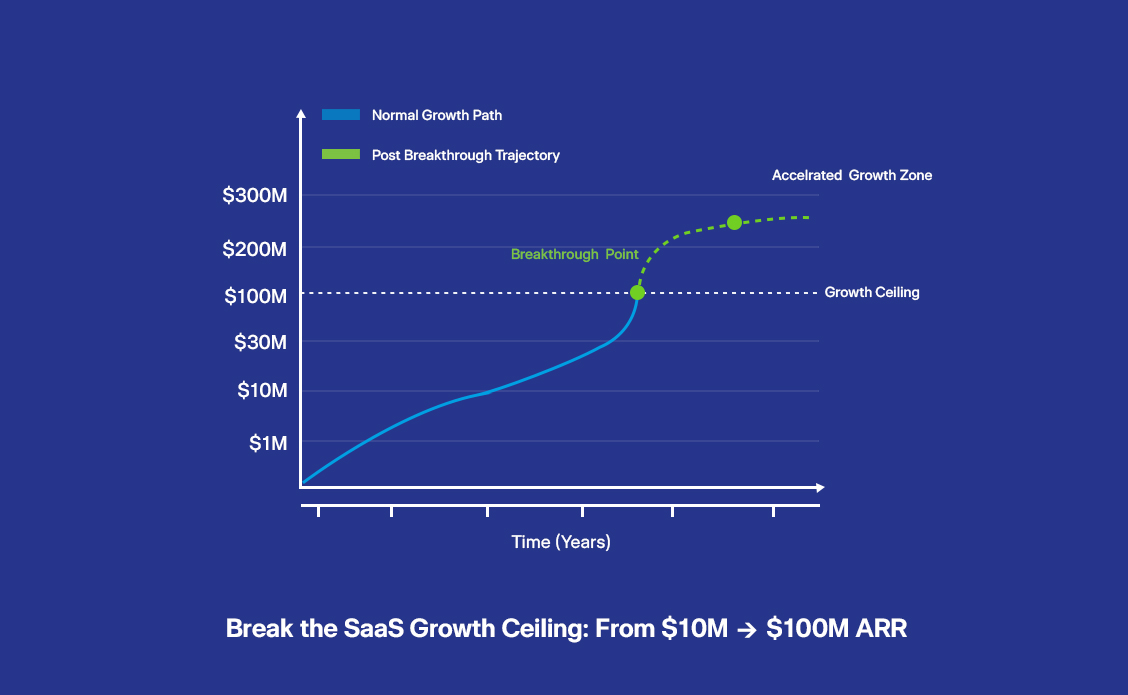
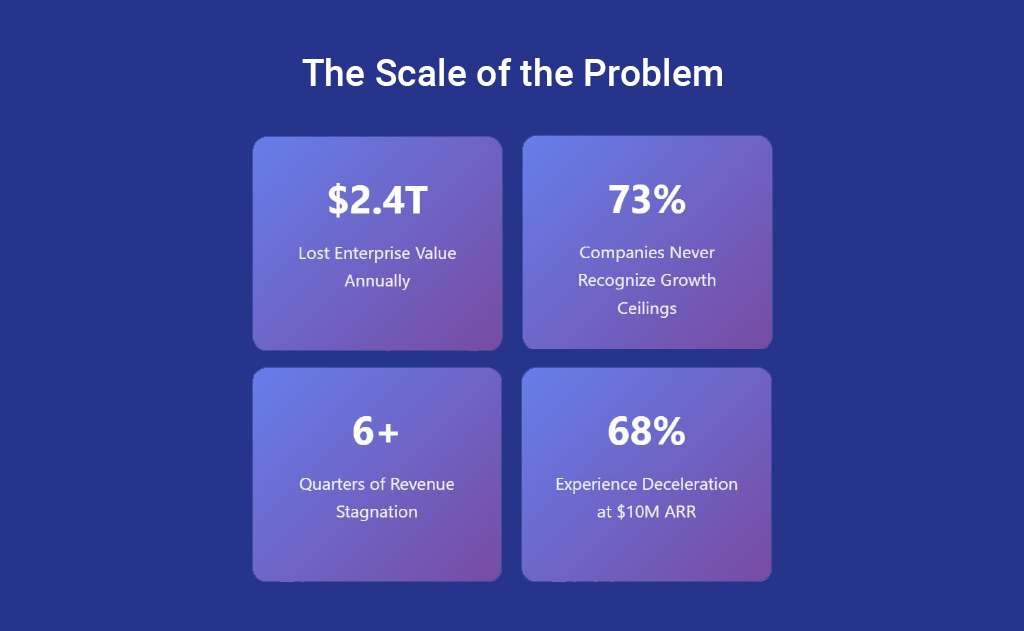
The invisible barriers that trap 73% of SaaS companies at predictable revenue thresholds, and the strategic framework to Break SaaS Growth Ceiling systematically.
The most critical insight? Growth ceilings aren’t revenue problems, they’re system problems. When your GTM motion, financial operations, and product positioning aren’t aligned for your current scale, growth becomes increasingly expensive and unsustainable.
| ARR Milestone | Primary Ceiling Driver | Operational Shift Required |
|---|---|---|
| $10M ARR | Founder-led sales limitations | Repeatable sales systems |
| $30M ARR | GTM channel conflicts | Scalable infrastructure |
| $100M ARR | Market penetration saturation | Multi-market expansion |
1. Plateauing CAC Efficiency
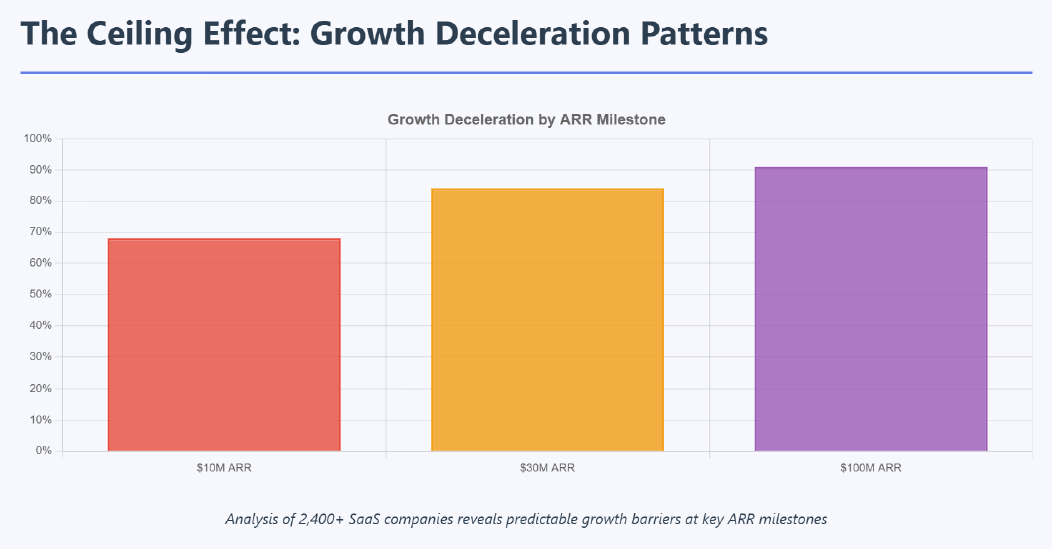
When customer acquisition costs begin rising faster than LTV expansion, growth becomes unsustainable. Recent analysis shows that 67% of SaaS companies see CAC efficiency decline by 15-30% annually without systematic optimization.
The Problem: 67% of SaaS companies experience 40-60% CAC inflation between $10M-$50M ARR as their primary acquisition channels reach saturation. Traditional growth strategies that worked at smaller scale create diminishing returns.
Data Point: Companies that don’t diversify acquisition channels by $25M ARR see CAC payback periods extend from 8 months to 24+ months, destroying unit economics.
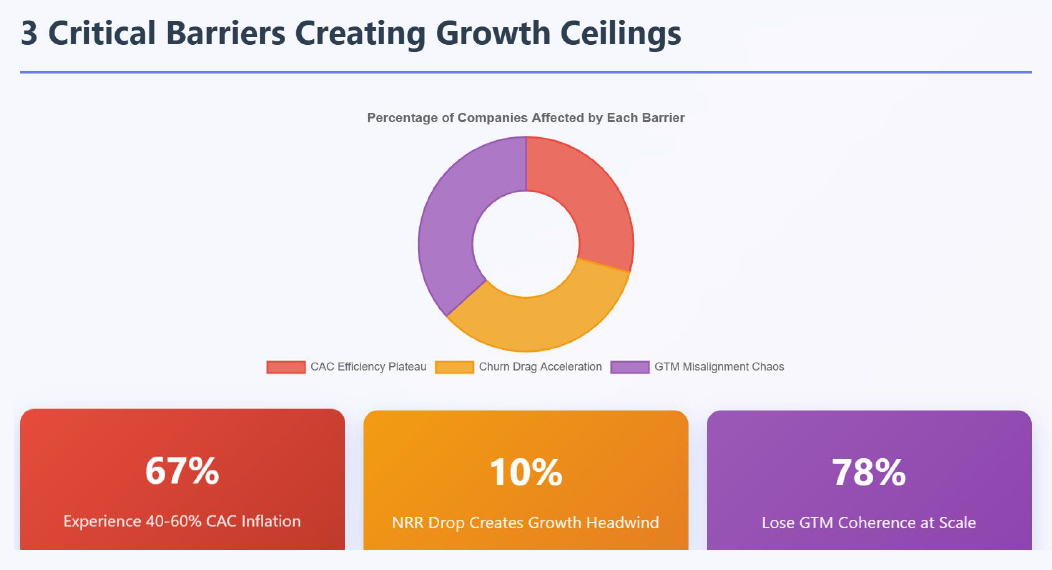
2. Churn Drag Acceleration
As customer bases mature, churn rates naturally increase unless retention systems scale proportionally. Companies with churn rates above 8% annually find growth increasingly expensive, as new acquisitions must overcome existing customer loss.
The Problem: Net Revenue Retention deteriorates predictably as companies scale. Our benchmarking shows NRR drops from 115%+ at $5M ARR to 105% at $30M ARR, creating a 10% growth headwind that compounds quarterly.
Hidden Impact: A 5% NRR decline at $50M ARR creates $15M+ in lost growth potential over 24 months, equivalent to hiring 150+ sales reps with zero productivity.
3. GTM Misalignment Chaos
When sales, marketing, and customer success operate with different definitions of ICP, qualified leads, and success metrics, operational friction increases exponentially with scale.
The Problem: As teams scale, strategic alignment deteriorates. 78% of SaaS companies lose GTM coherence between $15M-$40M ARR, creating internal competition for resources and conflicting customer experiences.
Quantified Impact: GTM misalignment reduces win rates by 23%, extends sales cycles by 35%, and increases churn risk by 18% across the entire customer lifecycle.
GTM Velocity Engine
Financial Operations Excellence
Operational Scale Readiness
The companies that Break SaaS Growth Ceiling barriers don’t rely on single-point solutions. They implement the 3D GTM Model, a systematic growth ceiling framework that synchronizes three critical dimensions:
Dimension 2: Financial Operations Excellence
Dimension 3: Operational Scale Readiness
Understanding your current growth stage and preparing for the next is critical for breaking ceilings before they form. Each stage requires different strategic levers and operational focus using proven SaaS growth strategies.
| ARR Stage | Typical Ceiling | Common Challenges | Strategic Levers | Success Metrics |
|---|---|---|---|---|
| $1–10M ARR | Founder-led sales plateau | Manual processes, limited repeatability | • Outbound systematization • PLG motion development • Sales infrastructure | • 40%+ YoY growth • <12-month CAC payback • 90%+ gross retention |
| $10–30M ARR | GTM misalignment chaos | Channel conflicts, process breakdown | • Sales segmentation • Marketing automation • Success systematization | • 110%+ NRR • <18-month CAC payback • 60%+ win rate |
| $30–100M ARR | CAC efficiency plateau | Market saturation, competition | • Multi-channel expansion • Monetization innovation • International preparation | • 30%+ YoY growth • Rule of 40 >40% • 120%+ NRR |
| $100M+ ARR | Market saturation limits | Geographic constraints, pricing power | • International scale • Inorganic growth • Platform expansion | • 25%+ YoY growth • 130%+ NRR • Market leadership |
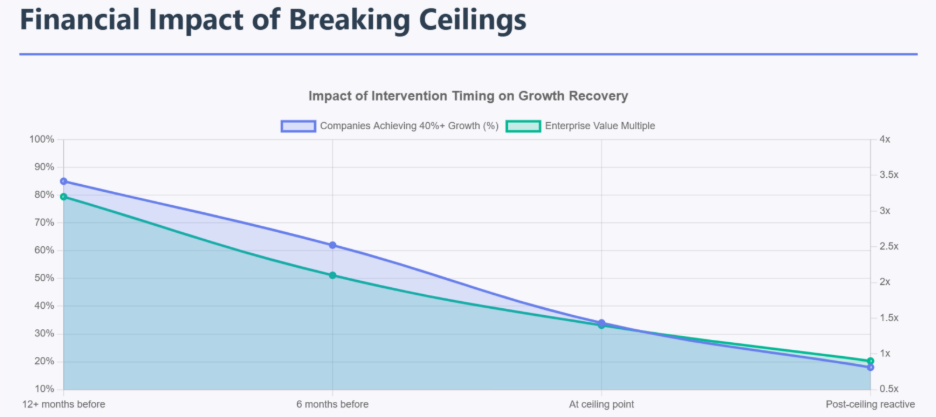
ARR Re-acceleration Benchmarks
| Intervention Timing | Growth Recovery | Timeline to Acceleration | Enterprise Value Impact |
|---|---|---|---|
| 12+ months before ceiling | 85% companies achieve 40%+ growth | 6–9 months | 3.2x baseline multiple |
| 6 months before ceiling | 62% companies achieve 30%+ growth | 9–15 months | 2.1x baseline multiple |
| At ceiling point | 34% companies achieve 20%+ growth | 18–36 months | 1.4x baseline multiple |
| Post-ceiling reactive | 18% companies achieve 15%+ growth | 36+ months | 0.9x baseline multiple |
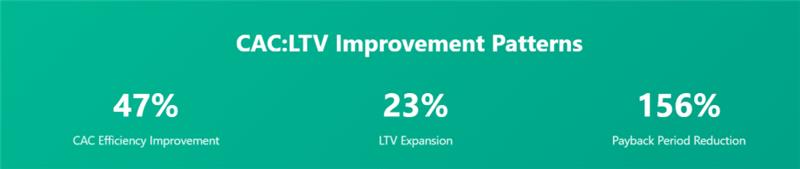
Companies implementing systematic ceiling breakthrough strategies achieve:
47% CAC efficiency improvement through multi-channel optimization
23% LTV expansion through retention and expansion program integration
156% payback period reduction through systematic conversion optimization
The compound effect: A $50M ARR company implementing these strategies 18 months before hitting the $75M ceiling adds $47M+ in enterprise value compared to reactive approaches. This demonstrates the power of ARR acceleration through proactive ceiling breakthrough planning.
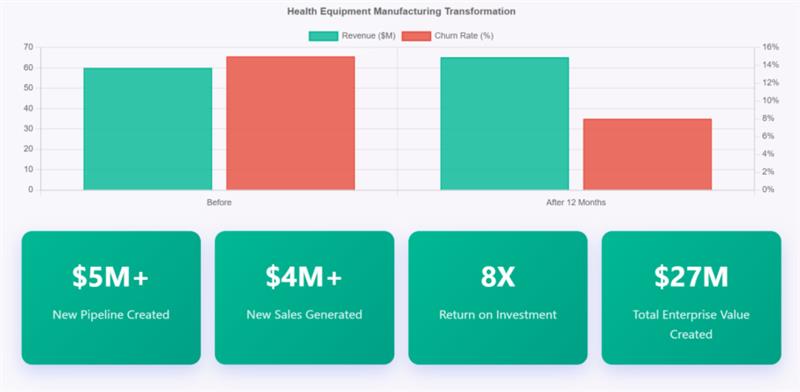
Before:
$60–80M revenue post-acute division in decline with 15% annual churn, ghost accounts, siloed teams, and weak engagement processes undermining growth and retention.
Strategic Interventions:
Results After 12 Months:
Enterprise Value:
$27M in total value creation from pipeline acceleration, recovered churn, and sustainable retention. The transformation rebuilt customer engagement into a systems-driven success model, positioning the company for stronger multiples and investor confidence.
Key Success Factor:
The turnaround wasn’t driven by a radical pivot; it was powered by disciplined execution and data-driven customer retention systems that converted hidden risk into measurable enterprise value.
This transformation demonstrates how systematic ceiling breakthrough creates compounding value across the entire business system, not just revenue growth.
Understanding investor expectations at each growth stage helps CEOs prioritize improvements that directly impact valuation and fundraising success.
Revenue Predictability (All Stages)
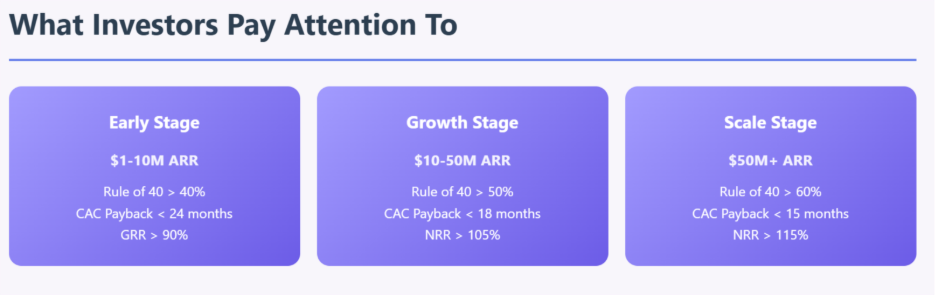
Early Stage ($1-10M ARR):
Growth Stage ($10-50M ARR):
Scale Stage ($50M+ ARR):
Evidence of Scalable GTM Systems
Breaking through SaaS growth ceilings isn’t about finding a single lever to pull, it’s about engineering systematic improvements across GTM, financial operations, and organizational capabilities that compound over time.
The most successful SaaS leaders understand that growth ceilings are opportunities disguised as problems. Each ceiling represents a chance to build more sophisticated, more defensible, more valuable business operations.
Will you engineer your breakthrough before hitting the ceiling, or react after growth stagnates?
Boost enterprise value — get simple, smart strategies in your inbox.
Increasing Enterprise Value. Delivering Results.
Don’t guess. Test.