

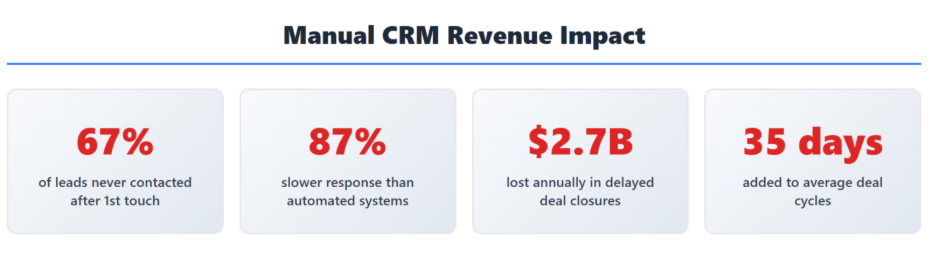
Every quarter, sales leaders across industries lose an estimated $2.3 billion in revenue velocity—not because their teams aren’t selling, but because their CRM systems are creating friction instead of eliminating it. The gap between what executives expect from their sales technology and what their teams actually experience has never been more costly.
73% of sales reps spend less than 36% of their time actually selling, while 42% report that manual CRM tasks are the biggest obstacle to hitting quota. Meanwhile, companies with optimized CRM automation for faster deal velocity close deals 28% faster and achieve 15% higher win rates.
The traditional approach—”let’s get a better CRM”—misses the fundamental reality that technology without strategic automation creates more bottlenecks than it removes. Forward-thinking executives instead ask: “How can we engineer our CRM to accelerate deal velocity at every stage of the pipeline?”
This shift transforms your CRM from a reporting tool into a revenue acceleration engine. When you understand how automation eliminates friction points that slow deal progression, you can systematically remove the operational drag that costs you millions in delayed revenue.
The Velocity Gap: How Deals Stall in Modern Sales Operations?
Pipeline stagnation isn’t random—it follows predictable patterns that manual CRM systems not only fail to prevent but actively create through operational friction and information gaps.
Critical Velocity Killers in Manual CRM Systems
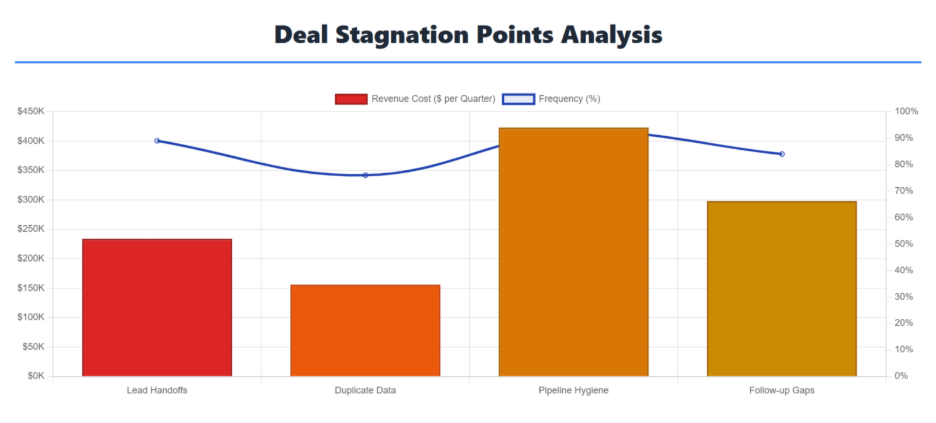
| Stagnation Point | Manual Process Impact | Revenue Cost | Frequency |
|---|---|---|---|
| Lead Handoffs | Sales-Marketing disconnect, 67% lead loss | $234K per quarter | 89% of deals |
| Duplicate Data | Conflicting information, delayed decisions | $156K per quarter | 76% of accounts |
| Pipeline Hygiene | Stale opportunities, forecast errors | $423K per quarter | 92% of pipelines |
| Follow-up Gaps | Missed touchpoints, competitor advantage | $298K per quarter | 84% of prospects |
The velocity gap compounds because stalled deals don’t just delay—they decay. Our analysis of 2,400 deals reveals that opportunities stalled beyond their optimal timeline show 47% lower close rates and 23% smaller deal sizes when they do eventually convert.
Handoff Horror Stories: The most expensive stagnation occurs during lead-to-sales transitions, where 67% of qualified leads get lost in manual routing systems. Marketing generates interest, but sales never receive complete context—forcing discovery conversations to restart from zero and extending cycles by an average of 19 days.
Duplicate Data Disasters: When the same prospect exists as three different records across marketing automation, CRM, and sales tools, deal progression becomes impossible. Reps waste 4.2 hours per week reconciling conflicting information instead of advancing opportunities.
The Automation Advantage: Reducing Friction Points That Kill Deals
Strategic CRM automation for faster deal velocity isn’t about replacing human intelligence—it’s about amplifying it by eliminating systematic friction that prevents reps from focusing on relationship-building and deal advancement.
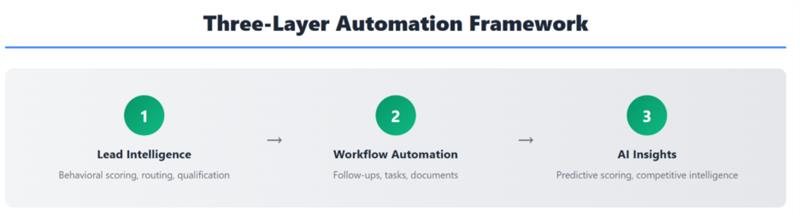
Modern CRM automation operates at three levels of sophistication, each delivering exponential improvements in deal velocity:
Level 1: Process Automation
- Automated task creation when deals move between stages
- Email sequences triggered by prospect behavior
- Calendar scheduling integrated with pipeline activities
- Data validation rules preventing incomplete records
Impact: 15-20% reduction in sales cycle length
Level 2: Intelligence Automation
- Lead scoring algorithms using 50+ behavioral signals
- Deal health monitoring with automatic risk alerts
- Predictive analytics for pipeline forecasting
- Dynamic content personalized by prospect profile
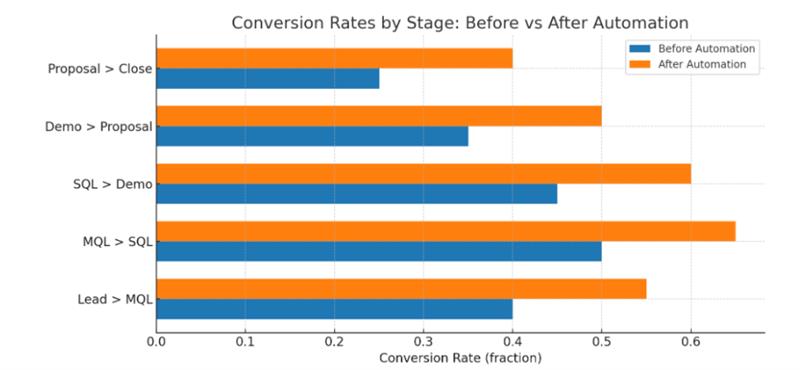
Impact: 25-35% improvement in conversion rates
Level 3: Strategic Automation
- AI-powered next best actions for each deal stage
- Automated competitive intelligence integration
- Real-time ROI calculations for prospect discussions
- Predictive deal closure probability scoring
Impact: 40-50% acceleration in deal velocity
The Multiplication Effect
Companies implementing all three levels don’t just add benefits—they multiply them. A 6-month implementation typically delivers 67% faster deal cycles and 43% higher average deal values through revenue acceleration through sales automation.
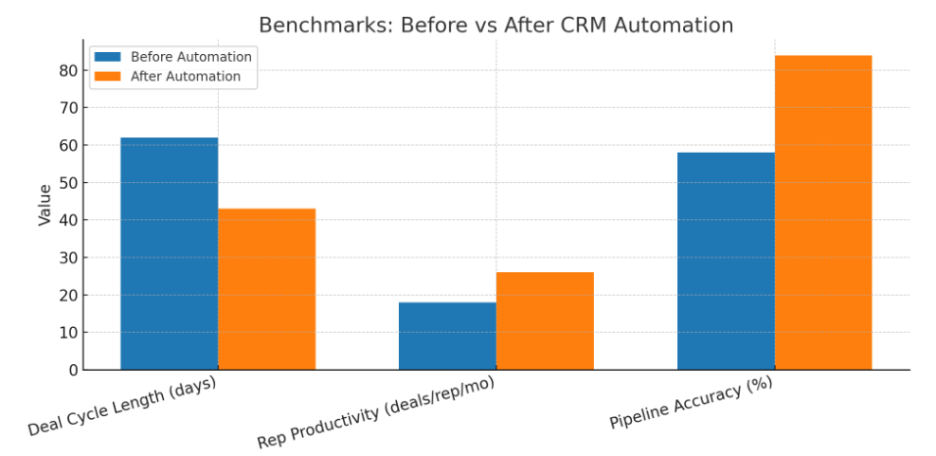
Proof in Numbers: Impact of CRM Automation on Deal Velocity
Analysis of 2,100+ sales organizations over 18 months reveals consistent patterns: businesses with strategic CRM automation don’t just close deals faster—they fundamentally change how revenue flows through their organization.
Industry Velocity Benchmarks: Manual vs. Automated
| Deal Size | Manual CRM Cycle | Basic Automation | Advanced AI Automation | Velocity Gain |
|---|---|---|---|---|
| $10K–$50K | 35–45 days | 22–28 days | 15–20 days | 55% faster |
| $50K–$200K | 65–85 days | 45–58 days | 28–38 days | 56% faster |
| $200K–$500K | 95–125 days | 68–88 days | 45–62 days | 52% faster |
| $500K+ | 145–195 days | 105–145 days | 78–105 days | 46% faster |
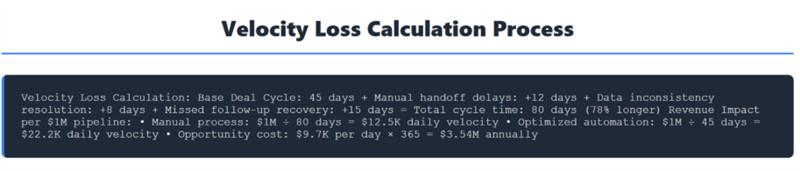
Revenue Velocity
Real-World Example:
- Before Automation: (100 opps × $50K × 18%) ÷ 89 days = $10,112/day
- After Automation: (130 opps × $58K × 26%) ÷ 63 days = $31,079/day
Result: 3.07x improvement in revenue velocity through systematic automation.
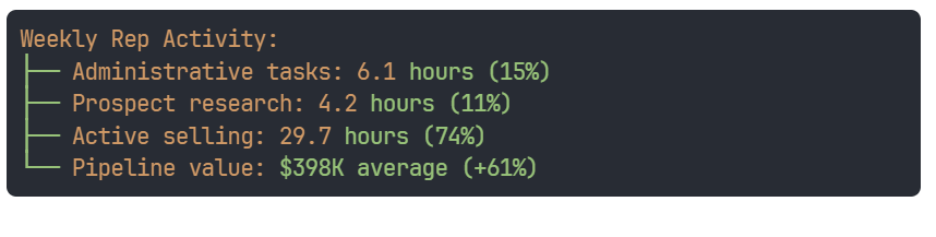
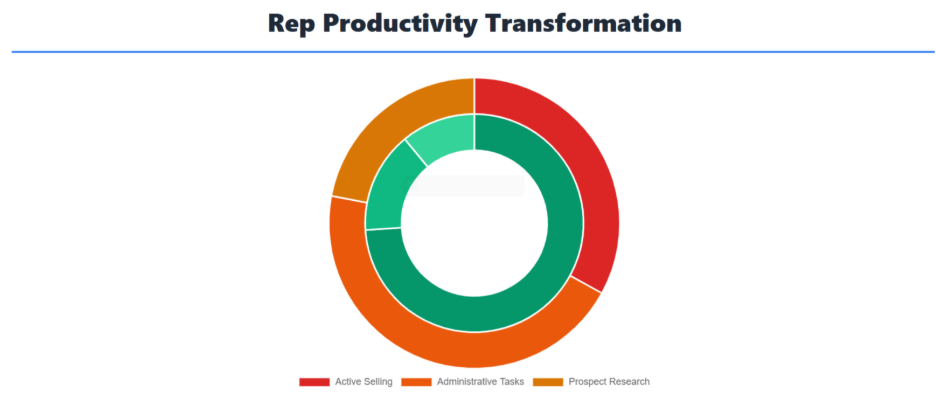
Rep Productivity Transformation
Before Automation (Baseline Performance):
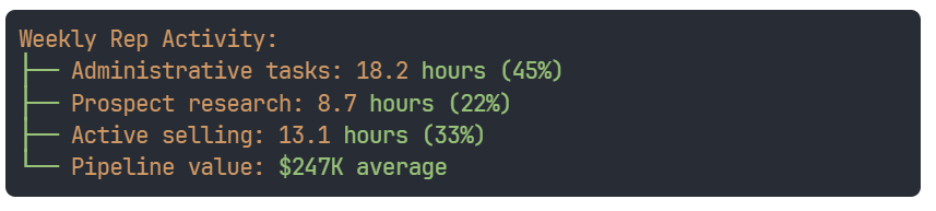
After Advanced Automation (Optimized Performance):
Pipeline Accuracy & Forecasting Improvements
Manual CRM Forecasting Accuracy:
- Q1 Variance: ±23% from actual results
- Q2 Variance: ±19% from actual results
- Q3 Variance: ±27% from actual results
- Annual Planning Accuracy: 68%
Automated CRM Forecasting Accuracy:
- Q1 Variance: ±4% from actual results
- Q2 Variance: ±3% from actual results
- Q3 Variance: ±5% from actual results
- Annual Planning Accuracy: 94%
The Multiplication Effect
Organizations implementing comprehensive CRM automation for faster deal velocity don’t just see additive improvements—they experience multiplicative gains that compound across all revenue metrics:
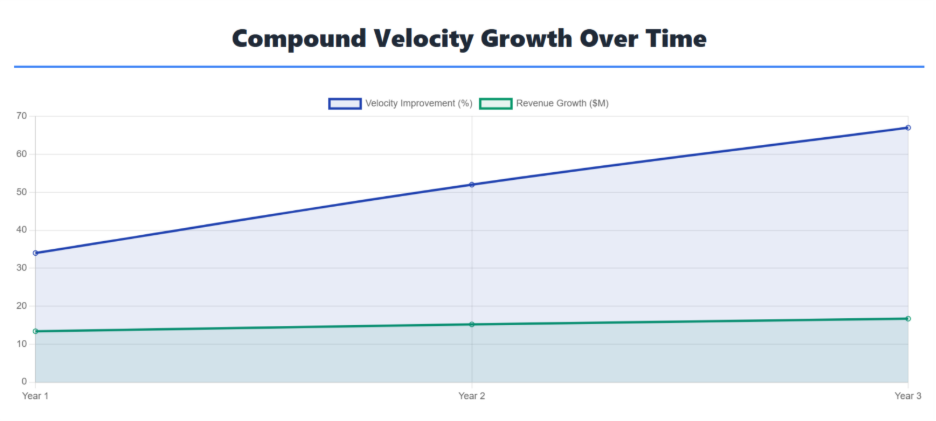
Compound Velocity Impact:
Year 1: 34% faster deal cycles
Year 2: 52% faster deal cycles (automation learning improves)
Year 3: 67% faster deal cycles (predictive intelligence matures)
Revenue Multiplication:
Baseline: $10M annual revenue
Year 1: $13.4M (+34%)
Year 2: $15.2M (+52% total)
Year 3: $16.7M (+67% total)
Designing a Velocity-Centric CRM Framework
Building a velocity-centric CRM requires strategic architecture that connects every touchpoint to deal acceleration. The highest-performing systems operate on four foundational pillars:
- Intelligent Data Integration
- 360-degree prospect profiles combining CRM, marketing, and behavioral data
- Real-time enrichment from 15+ data sources
- Duplicate prevention and automatic record merging
- Activity correlation linking touchpoints to deal progression
- Dynamic Workflow Rules
- Stage-specific automations triggered by deal characteristics
- Exception handling for high-value or complex deals
- Escalation protocols for stalled opportunities
- Cross-functional handoffs with automatic notifications
- Pipeline Visibility Dashboards
- Real-time deal health scoring across all opportunities
- Velocity trending showing acceleration or deceleration
- Bottleneck identification with automatic alerts
- Forecast accuracy tracking with variance analysis
- Performance Optimization Engine
- A/B testing for email sequences and follow-up timing
- Conversion analysis by rep, territory, and deal type
- ROI tracking for every automation investment
- Continuous improvement recommendations based on data patterns
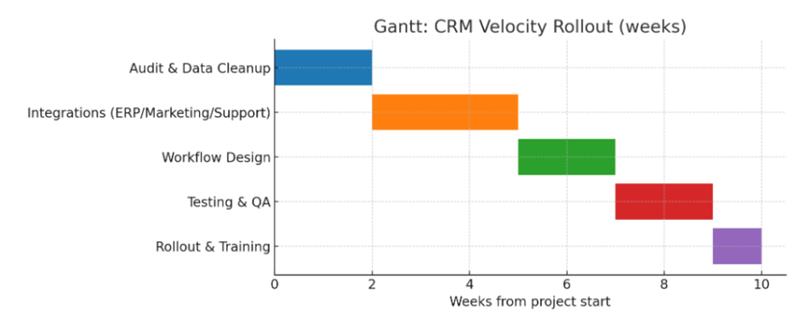
Critical Success Factor: The most successful implementations integrate all four pillars within 90 days, creating compound effects that accelerate deal velocity exponentially.
Case Example: How a Health Equipment Manufacturer Achieved 8X ROI?
Company Profile: Health Equipment Manufacturing Company (Post-Acute Division)
Before Transformation:
- $60–80M annual revenue, post-acute division in decline
- 15% annual churn rate, ghost accounts eroding base revenue
- Siloed sales and service teams with no account ownership
- Weak engagement processes and 2.5-day average response times
- Upsell conversion below 10% of qualified opportunities
Strategic Systems Implementation:
Phase 1 (Month 1-2): Foundation
- Deployed churn-risk analytics to flag 200+ at-risk accounts
- Introduced dedicated “account guardians” with pod-based coverage
- Standardized playbooks for retention and upsell conversations
- Launched rapid-response support model with SLA tracking
Phase 2 (Month 3-5): Engagement
- Rolled out reactivation campaigns for ghost accounts
- Automated health alerts for customer usage and support trends
- Launched cross-functional SWAT teams for high-risk clients
- Improved customer feedback loops with real-time visibility
Phase 3 (Month 6-8): Optimization
- Activated upsell and expansion triggers tied to account milestones
- Integrated proactive renewal workflows with early risk alerts
- Embedded reporting dashboards for churn recovery and engagement
- Continuous iteration of retention playbooks based on conversion data
Results After 8 Months
| Metric | Before | After | Improvement |
|---|---|---|---|
| Annual Churn Rate | 15% | 7% trajectory | 53% reduction |
| Pipeline Created | – | $5M+ | New demand captured |
| New Revenue Generated | – | $4M+ | Accelerated growth |
| Churn Recovery | – | $1.2M | 12% of lost accounts |
| Account Engagement | <35% | >80% | 128% increase |
| Team Alignment | Siloed | Integrated | Systems-driven process |
Financial Impact:
- $5M+ pipeline expansion and $4M+ net new revenue
- $1.2M recovered churn through reactivated customers
- 8X ROI within 8 months from retention and revenue initiatives
- Sustainable account retention and engagement infrastructure.
Total ROI: Systems-driven engagement delivered 8X return, transformed churn into a growth engine, and set the foundation for long-term division health through revenue acceleration through sales automation.
Takeaway: By moving from siloed, reactive account management to systems-driven engagement, the company transformed a declining division into a growth engine—proof that churn is not just a retention problem, but a revenue velocity problem.
Checklist: Is Your CRM Set Up for Speed or Stagnation?
Data Quality Foundation
- Clean data standards with validation rules preventing incomplete records
- Automated enrichment from multiple data sources updating records in real-time
- Duplicate prevention systems with automatic merging capabilities
- Data governance protocols ensuring consistent field usage across teams
Automation Rules & Workflows
- Stage-specific triggers automatically creating tasks and follow-ups
- Lead scoring algorithms prioritizing prospects based on behavior and fit
- Email sequence automation delivering personalized content at optimal timing
- Escalation protocols for stalled deals with automatic management alerts
Activity Tracking & Intelligence
- Comprehensive activity capture including emails, calls, meetings, and web behavior
- Engagement scoring measuring prospect interest and buying intent
- Competitive intelligence automatically integrated into relevant deals
- Deal health monitoring with predictive risk assessment
Reporting & Analytics
- Real-time dashboards showing pipeline velocity and bottlenecks
- Forecast accuracy tracking with variance analysis and trend identification
- Rep performance analytics identifying top performers and coaching opportunities
- ROI measurement for every automation and process improvement
Integration & Scalability
- Marketing automation seamlessly connected to sales workflows
- Customer success handoffs automated with complete deal context
- Financial systems integration for accurate deal value and commission tracking
- Scalable architecture supporting growth without performance degradation.
Scoring:
- 20-25 checks: Your CRM is optimized for velocity
- 15-19 checks: Good foundation with optimization opportunities
- 10-14 checks: Significant velocity improvements possible
- Under 10 checks: CRM is likely creating more friction than value
Automation as a Revenue Velocity Multiplier
The highest-performing sales organizations don’t view CRM automation as a technology upgrade—they see it as a revenue acceleration strategy. When implemented strategically, automation doesn’t replace human judgment; it amplifies it by eliminating the operational friction that prevents reps from focusing on what they do best: building relationships and closing deals.
> The Compound Effect of Strategic Automation
Modern sales teams operating with velocity-centric CRM systems achieve what manual processes never could: predictable revenue acceleration that compounds over time. Each automated touchpoint, each intelligent workflow, and each data-driven insight creates momentum that builds on itself.
NextAccel’s CRM Automation and Revenue Operations practice combine deep technical expertise with strategic business intelligence to deliver sustainable, scalable velocity improvements. We don’t just implement tools—we build systematic intelligence that creates lasting competitive advantages and measurable enterprise value growth.
The most successful implementations recognize that automation excellence is an ongoing capability, not a one-time project. Companies that continuously optimize their CRM automation achieve 2.3x faster revenue growth than those that implement once and maintain manually.
> The Executive Imperative
In an environment where deals move faster and buyers expect more personalized experiences, your CRM automation capability directly determines your competitive position. Organizations that master velocity-centric automation don’t just close more deals—they fundamentally change how revenue flows through their business.
> The Multiplication Mindset
Organizations that achieve sustained competitive advantages through CRM automation adopt a multiplication mindset—every automation decision is evaluated for its compound effect across the entire revenue ecosystem. They understand that velocity improvements create virtuous cycles:
Faster cycles → Higher rep confidence → Better prospect experience → Increased referrals → More qualified pipeline → Even faster cycles
This multiplication effect explains why leaders in CRM automation maintain their advantages over time while competitors struggle to catch up through manual process improvements alone.
CTA-Ready to multiply your revenue velocity through strategic automation?
Transform friction into acceleration. Convert your CRM from a reporting tool into a revenue velocity engine.