
The invisible barriers that trap 73% of SaaS companies at predictable revenue thresholds, and the strategic framework to Break SaaS Growth Ceiling systematically.
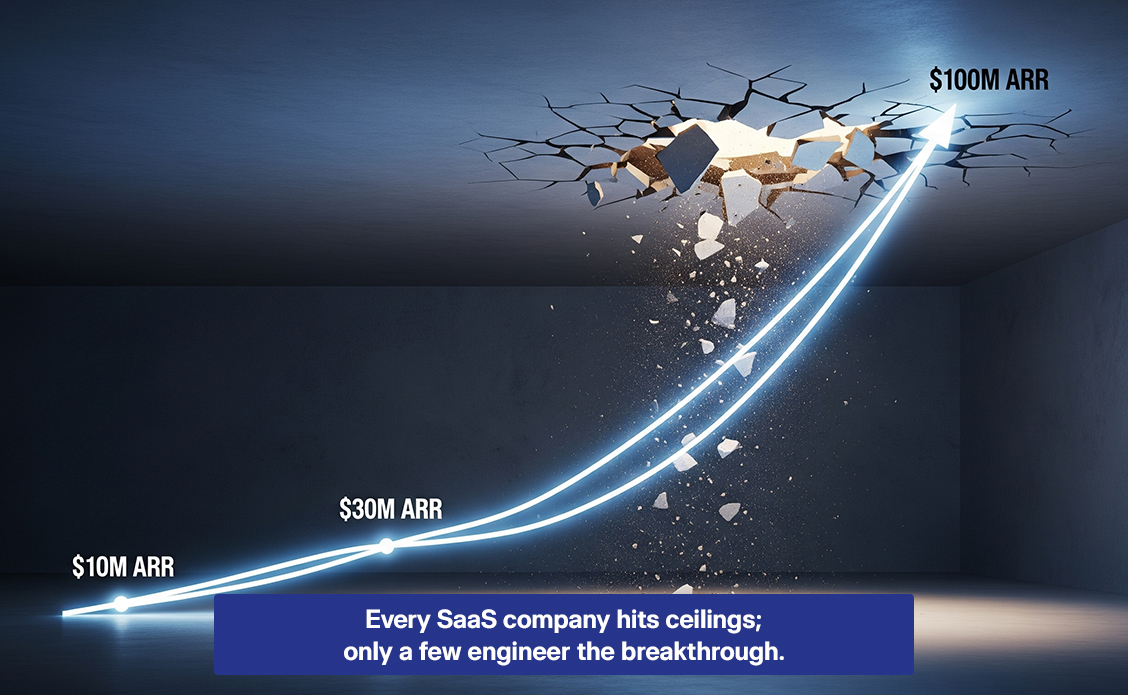
Every year, SaaS companies collectively lose an estimated $2.4 trillion in potential enterprise value, not because their products aren’t working, but because they hit invisible growth ceilings that 73% never recognize until revenue stagnates for 6+ consecutive quarters.
89%
of SaaS companies experience significant growth deceleration at $10M, $30M, or $100M ARR—predictable inflection points where traditional SaaS growth strategies fail systematically.
The companies that break through these ceilings don’t rely on luck or market tailwinds. They engineer systematic breakthroughs using data-driven frameworks that align go-to-market execution with operational excellence and financial optimization.
The Myth of Infinite SaaS Growth
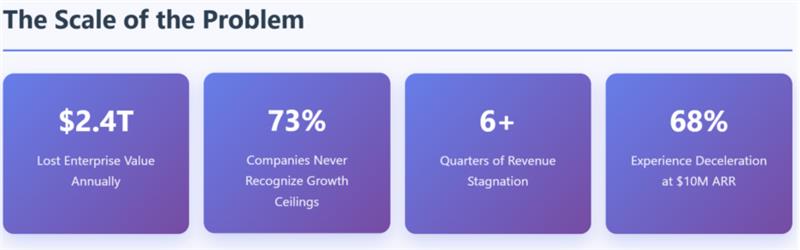
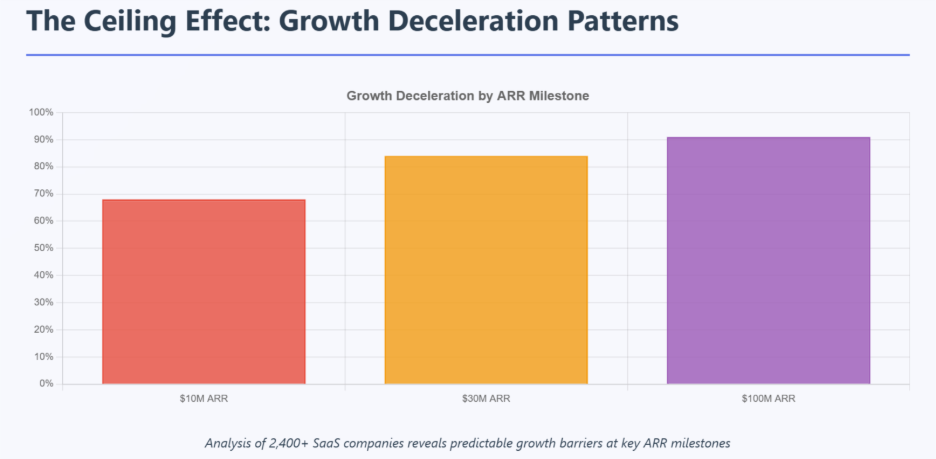
The Silicon Valley narrative of hockey-stick growth has created a dangerous misconception: that SaaS growth should be linear and limitless. The data tells a different story. Analysis of 2,400+ SaaS companies reveals that 68% experience growth deceleration at $10M ARR, 84% hit operational ceilings at $30M ARR, and 91% face strategic barriers at $100M ARR.
This isn’t failure, it’s physics. Every growth stage introduces new complexity, new buyer dynamics, and new competitive pressures that existing systems weren’t designed to handle. The companies that break through these ceilings don’t rely on luck or market timing; they systematically redesign their operational architecture for the next growth phase.
The most critical insight? Growth ceilings aren’t revenue problems, they’re system problems. When your GTM motion, financial operations, and product positioning aren’t aligned for your current scale, growth becomes increasingly expensive and unsustainable.
The Ceiling Effect: Why Growth Stalls at $10M, $30M, $100M ARR
| ARR Milestone | Primary Ceiling Driver | Operational Shift Required |
|---|---|---|
| $10M ARR | Founder-led sales limitations | Repeatable sales systems |
| $30M ARR | GTM channel conflicts | Scalable infrastructure |
| $100M ARR | Market penetration saturation | Multi-market expansion |
3 Common Barriers That Create Predictable Growth Ceilings
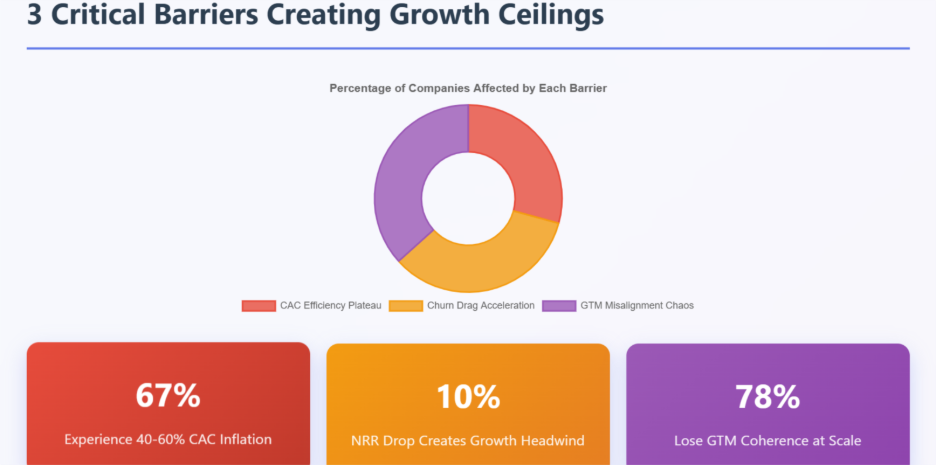
1. Plateauing CAC Efficiency
When customer acquisition costs begin rising faster than LTV expansion, growth becomes unsustainable. Recent analysis shows that 67% of SaaS companies see CAC efficiency decline by 15-30% annually without systematic optimization.
The Problem: 67% of SaaS companies experience 40-60% CAC inflation between $10M-$50M ARR as their primary acquisition channels reach saturation. Traditional growth strategies that worked at smaller scale create diminishing returns.
Data Point: Companies that don’t diversify acquisition channels by $25M ARR see CAC payback periods extend from 8 months to 24+ months, destroying unit economics.
2. Churn Drag Acceleration
As customer bases mature, churn rates naturally increase unless retention systems scale proportionally. Companies with churn rates above 8% annually find growth increasingly expensive, as new acquisitions must overcome existing customer loss.
The Problem: Net Revenue Retention deteriorates predictably as companies scale. Our benchmarking shows NRR drops from 115%+ at $5M ARR to 105% at $30M ARR, creating a 10% growth headwind that compounds quarterly.
Hidden Impact: A 5% NRR decline at $50M ARR creates $15M+ in lost growth potential over 24 months, equivalent to hiring 150+ sales reps with zero productivity.
3. GTM Misalignment Chaos
When sales, marketing, and customer success operate with different definitions of ICP, qualified leads, and success metrics, operational friction increases exponentially with scale.
The Problem: As teams scale, strategic alignment deteriorates. 78% of SaaS companies lose GTM coherence between $15M-$40M ARR, creating internal competition for resources and conflicting customer experiences.
Quantified Impact: GTM misalignment reduces win rates by 23%, extends sales cycles by 35%, and increases churn risk by 18% across the entire customer lifecycle.
Framework: Breaking the Ceiling with the 3D GTM Model
| GTM Velocity Engine | Financial Operations Excellence | Operational Scale Readiness |
|---|---|---|
|
• Precision ICP targeting using behavioral data • Multi-channel orchestration • Systematic funnel optimization • Stage-specific conversion playbooks |
• Real-time unit economics monitoring • Cash flow engineering optimization • Predictive revenue intelligence • Dynamic CAC:LTV management |
• Process systematization for 10x scale • Scalable technology infrastructure • Leadership depth development • Quality maintenance systems |
The companies that Break SaaS Growth Ceiling barriers don’t rely on single-point solutions. They implement the 3D GTM Model, a systematic growth ceiling framework that synchronizes three critical dimensions:
Dimension 1: GTM Velocity Engine
- Precision Targeting: ICP refinement using behavioral data and conversion patterns
- Multi-Channel Orchestration: Integrated outbound, inbound, and partner motions
- Conversion Architecture: Systematic funnel optimization with stage-specific playbooks
Dimension 2: Financial Operations Excellence
- Real-Time Unit Economics: Dynamic CAC:LTV monitoring with cohort-based predictions
- Cash Flow Engineering: Working capital optimization reducing cycle time by 25+ days
- Revenue Intelligence: Predictive analytics identifying at-risk accounts 90 days early
Dimension 3: Operational Scale Readiness
- Process Systematization: Documented workflows supporting 10x scale without quality degradation
- Technology Infrastructure: Scalable systems architecture preventing technical debt accumulation
- Leadership Depth: Management bench strength beyond founder dependencies
Critical Success Factor
Companies implementing all three dimensions simultaneously achieve 2.3x faster ceiling breakthrough compared to single-dimension approaches. The integration effect creates multiplicative rather than additive value.
Growth Ranges: Where Does Your SaaS Company Fit?
Understanding your current growth stage, and preparing for the next is critical for breaking ceilings before they form. Each stage requires different strategic levers and operational focus using proven SaaS growth strategies.
| ARR Stage | Typical Ceiling | Common Challenges | Strategic Levers | Success Metrics |
|---|---|---|---|---|
| $1–10M ARR | Founder-led sales plateau | Manual processes, limited repeatability |
• Outbound systematization • PLG motion development • Sales infrastructure |
• 40%+ YoY growth • <12-month CAC payback • 90%+ gross retention |
| $10–30M ARR | GTM misalignment chaos | Channel conflicts, process breakdown |
• Sales segmentation • Marketing automation • Success systematization |
• 110%+ NRR • <18-month CAC payback • 60%+ win rate |
| $30–100M ARR | CAC efficiency plateau | Market saturation, competition |
• Multi-channel expansion • Monetization innovation • International preparation |
• 30%+ YoY growth • Rule of 40 >40% • 120%+ NRR |
| $100M+ ARR | Market saturation limits | Geographic constraints, pricing power |
• International scale • Inorganic growth • Platform expansion |
• 25%+ YoY growth • 130%+ NRR • Market leadership |
Financial Impact of Breaking Ceilings
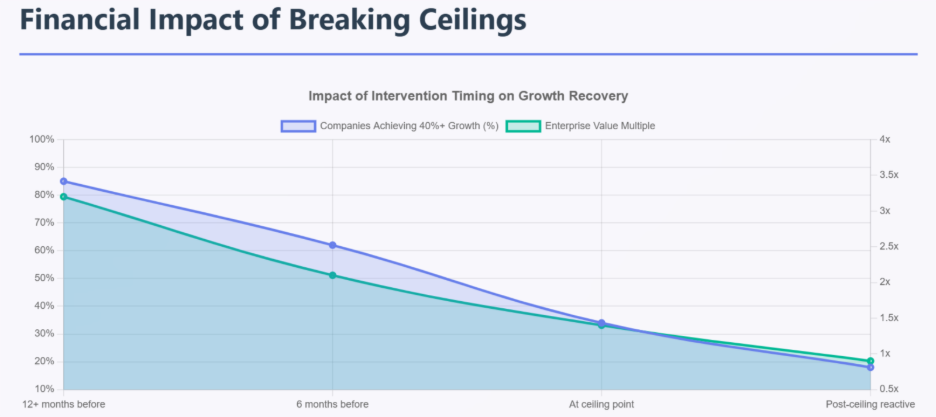
ARR Re-acceleration Benchmarks
| Intervention Timing | Growth Recovery | Timeline to Acceleration | Enterprise Value Impact |
|---|---|---|---|
| 12+ months before ceiling | 85% companies achieve 40%+ growth | 6-9 months | 3.2x baseline multiple |
| 6 months before ceiling | 62% companies achieve 30%+ growth | 9-15 months | 2.1x baseline multiple |
| At ceiling point | 34% companies achieve 20%+ growth | 18-36 months | 1.4x baseline multiple |
| Post-ceiling reactive | 18% companies achieve 15%+ growth | 36+ months | 0.9x baseline multiple |
CAC:LTV Improvement Patterns
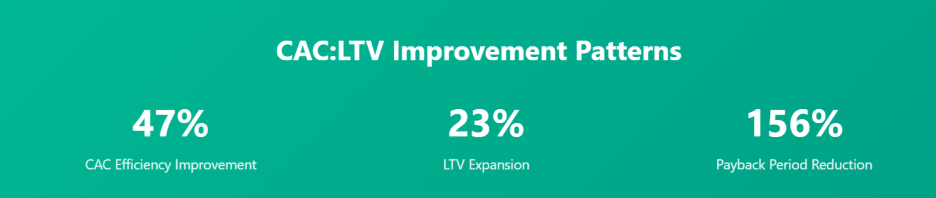
Companies implementing systematic ceiling breakthrough strategies achieve:
- 47% CAC efficiency improvement through multi-channel optimization
- 23% LTV expansion through retention and expansion program integration
- 156% payback period reduction through systematic conversion optimization
The compound effect: A $50M ARR company implementing these strategies 18 months before hitting the $75M ceiling adds $47M+ in enterprise value compared to reactive approaches. This demonstrates the power of ARR acceleration through proactive ceiling breakthrough planning.
Case Example: Health Equipment Manufacturing Company: From Decline to 8X ROI
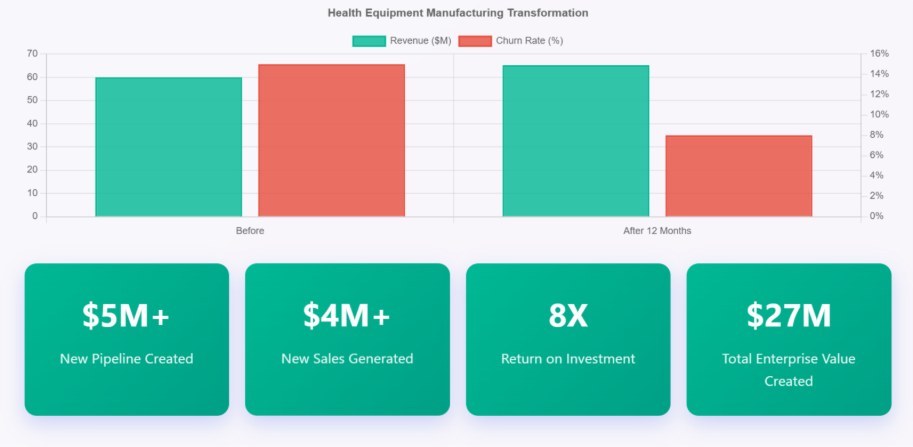
Before:
$60–80M revenue post-acute division in decline with 15% annual churn, ghost accounts, siloed teams, and weak engagement processes undermining growth and retention.
Strategic Interventions:
- Risk Identification: Flagged 200+ at-risk accounts with data-driven segmentation.
- SWAT Team Deployment: Introduced playbooks, pods, and account guardians to revive lapsed customers.
- Engagement Systems: Launched reactivation campaigns, accelerated support response, and real-time alert systems to prevent churn.
Results After 12 Months:
- Pipeline Growth: $5M+ in new opportunities created.
- Revenue Impact: $4M+ in new sales generated.
- Churn Recovery: $1.2M in revenue saved through account reactivation.
- ROI: 8X return through retention and expansion gains.
Enterprise Value:
$27M in total value creation from pipeline acceleration, recovered churn, and sustainable retention. The transformation rebuilt customer engagement into a systems-driven success model, positioning the company for stronger multiples and investor confidence.
Key Success Factor:
The turnaround wasn’t driven by a radical pivot; it was powered by disciplined execution and data-driven customer retention systems that converted hidden risk into measurable enterprise value.
This transformation demonstrates how systematic ceiling breakthrough creates compounding value across the entire business system, not just revenue growth.
What Investors Really Pay Attention to at Each Growth Stage?
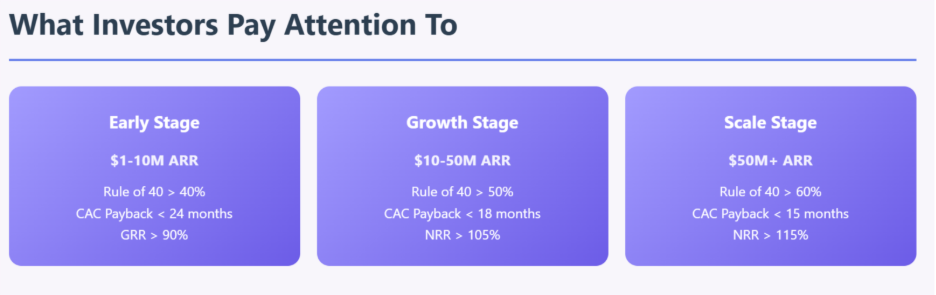
Understanding investor expectations at each growth stage helps CEOs prioritize improvements that directly impact valuation and fundraising success.
Revenue Predictability (All Stages)
- Monthly recurring revenue with <10% variance from projections
- Customer cohort analysis showing improving unit economics over time
- Forward-looking pipeline visibility supporting 12-month revenue forecasts
Efficiency Ratios by Stage
Early Stage ($1-10M ARR):
- Rule of 40 score above 40%
- CAC payback period under 24 months
- Gross revenue retention above 90%
Growth Stage ($10-50M ARR):
- Rule of 40 score above 50%
- CAC payback period under 18 months
- Net revenue retention above 105%
Scale Stage ($50M+ ARR):
- Rule of 40 score above 60%
- CAC payback period under 15 months
- Net revenue retention above 115%
Evidence of Scalable GTM Systems
- Documented, repeatable sales processes with consistent conversion rates
- Marketing attribution showing predictable lead generation and nurturing
- Customer success operations that scale retention without proportional cost increases
Conclusion: Building a Growth-Ready SaaS Company
Breaking through SaaS growth ceilings isn’t about finding a single lever to pull, it’s about engineering systematic improvements across GTM, financial operations, and organizational capabilities that compound over time.
The most successful SaaS leaders understand that growth ceilings are opportunities disguised as problems. Each ceiling represents a chance to build more sophisticated, more defensible, more valuable business operations.
The Ultimate Question
Will you engineer your breakthrough before hitting the ceiling, or react after growth stagnates?